▶SpringBoot监控 - 集成actuator监控工具
当SpringBoot的应用部署到生产环境中后,如何监控和管理呢?比如审计日志,监控状态,指标收集等。为了解决这个问题,SpringBoot提供了Actuator。本文主要介绍Spring Boot Actuator及实现案例。@pdai
知识准备
需要了解什么是Spring Boot Actuator, 以及其提供的功能(Endpoints)。
什么是Actuator?
致动器(actuator)是2018年公布的计算机科学技术名词。
百度百科的解释如下: 致动器能将某种形式的能量转换为机械能的驱动装置。如热致动器、磁致动器等,在磁盘中是指将电能转换为机械能并带动磁头运动的装置。
官网给的解释是:An actuator is a manufacturing term that refers to a mechanical device for moving or controlling something. Actuators can generate a large amount of motion from a small change.
从上述的解释不难知道Spring 命名这个组件为Actuator,就是为了提供监测程序的能力。
什么是Spring Boot Actuator?
什么是Spring Boot Actuator? 用在什么样的场景呢?
Spring Boot Actuator提供了对SpringBoot应用程序(可以是生产环境)监视和管理的能力, 可以选择通过使用HTTP Endpoint或使用JMX来管理和监控SpringBoot应用程序。
什么是Actuator Endpoints?
Spring Boot Actuator 允许你通过Endpoints对Spring Boot进行监控和交互。
Spring Boot 内置的Endpoint包括(两种Endpoint: WEB和JMX, web方式考虑到安全性默认只开启了/health):
| ID | JMX | Web | Endpoint功能描述 |
|---|---|---|---|
| auditevents | Yes | No | 暴露当前应用的audit events (依赖AuditEventRepository) |
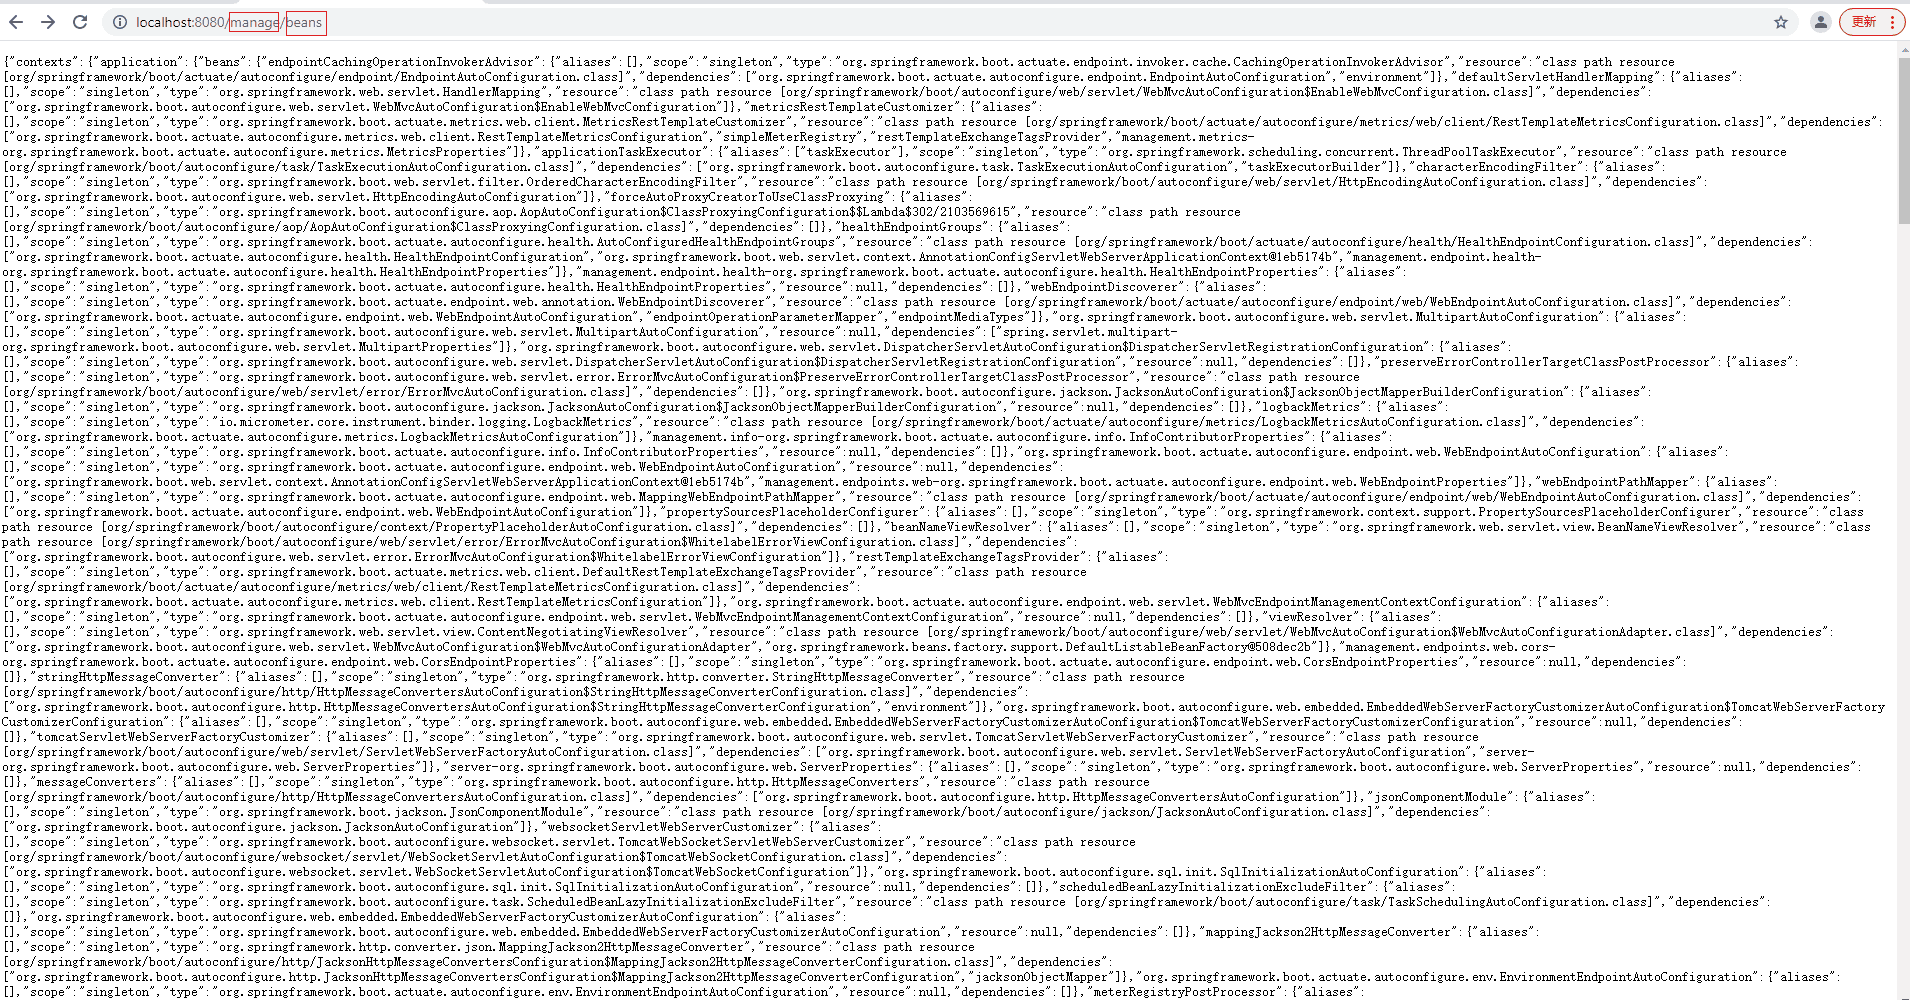
| beans | Yes | No | Spring中所有Beans |
| caches | Yes | No | 暴露可用的缓存 |
| conditions | Yes | No | 展示configuration 和auto-configuration类中解析的condition,并展示是否匹配的信息. |
| configprops | Yes | No | 展示所有的@ConfigurationProperties |
| env | Yes | No | 展示环境变量,来源于ConfigurableEnvironment |
| flyway | Yes | No | flyway数据迁移信息(依赖Flyway) |
| health | Yes | Yes | 展示应用的健康信息 |
| heapdump | N/A | No | (web应用时)hprof 堆的dump文件(依赖HotSpot JVM) |
| httptrace | Yes | No | 展示HTTP trace信息, 默认展示前100个(依赖HttpTraceRepository) |
| info | Yes | No | 应用信息 |
| integrationgraph | Yes | No | 展示spring集成信息(依赖spring-integration-core) |
| jolokia | N/A | No | (web应用时)通过HTTP暴露JMX beans(依赖jolokia-core) |
| logfile | N/A | No | (web应用时)如果配置了logging.file.name 或者 logging.file.path,展示logfile内容 |
| loggers | Yes | No | 展示或者配置loggers,比如修改日志的等级 |
| liquibase | Yes | No | Liquibase 数据迁移信息(依赖Liquibase) |
| metrics | Yes | No | 指标信息 |
| mappings | Yes | No | @RequestMapping映射路径 |
| prometheus | N/A | No | (web应用时)向prometheus暴露监控信息(依赖micrometer-registry-prometheus) |
| quartz | Yes | No | 展示 quartz任务信息 |
| scheduledtasks | Yes | No | 展示Spring Scheduled 任务信息 |
| sessions | Yes | No | session信息 |
| shutdown | Yes | No | 关闭应用 |
| startup | Yes | No | 展示ApplicationStartup的startup步骤的数据(依赖通在SpringApplication配置BufferingApplicationStartup) |
| threaddump | Yes | No | 线程dump |
当然你也可以自己定义暴露哪些endpoint,
不如JMX时:
management:
  endpoints:
    jmx:
      exposure:
        include: "health,info"
web时(*代表所有):
management:
  endpoints:
    web:
      exposure:
        include: "*"
        exclude: "env,beans"
简单示例
我们通过一个简单的例子,来展示自定义配置指定的endpoint,然后围绕这个简单的例子,谈谈后续拓展。
POM引入actuator包
<dependency>
    <groupId>org.springframework.boot</groupId>
    <artifactId>spring-boot-starter-actuator</artifactId>
</dependency>
yml配置
自定义暴露哪些endpoint, 比如如下yml配置
server:
  port: 8080

management:
  endpoints:
    enabled-by-default: false
    web:
      base-path: /manage
      exposure:
        include: 'info,health,env,beans'
  endpoint:
    info:
      enabled: true
    health:
      enabled: true
    env:
      enabled: true
    beans:
      enabled: true
上述配置只暴露info,health,env,beans四个endpoints, web通过可以/manage访问,
Endpoints的进一步拓展配置
与SpringSecurity集成保障安全
正是由于endpoint可能潜在暴露应用的安全性,web方式的endpoint才在默认情况下只暴露了一个/health。
如果你需要暴露更多,并保证endpoint接口安全,可以与Spring Security集成,比如
@Configuration(proxyBeanMethods = false)
public class MySecurityConfiguration {

    @Bean
    public SecurityFilterChain securityFilterChain(HttpSecurity http) throws Exception {
        http.requestMatcher(EndpointRequest.toAnyEndpoint())
                .authorizeRequests((requests) -> requests.anyRequest().hasRole("ENDPOINT_ADMIN"));
        http.httpBasic();
        return http.build();
    }

}
Endpoint跨域访问
跨域访问,可以通过如下配置:
management:
  endpoints:
    web:
      cors:
        allowed-origins: "https://example.com"
        allowed-methods: "GET,POST"
实现自己的Endpoint
我们可以通过@JmxEndpoint or @WebEndpoint注解来定义自己的endpoint, 然后通过@ReadOperation, @WriteOperation或者@DeleteOperation来暴露操作,
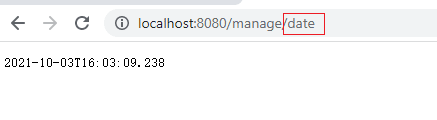
比如添加系统时间date的endpoint
package tech.pdai.springboot.actuator;

import java.time.LocalDateTime;

import org.springframework.boot.actuate.endpoint.annotation.ReadOperation;
import org.springframework.boot.actuate.endpoint.web.annotation.WebEndpoint;
import org.springframework.http.ResponseEntity;
import org.springframework.web.bind.annotation.RestController;

/**
 * @author pdai
 */
@RestController("custom")
@WebEndpoint(id = "date")
public class CustomEndpointController {

    @ReadOperation
    public ResponseEntity<String> currentDate() {
        return ResponseEntity.ok(LocalDateTime.now().toString());
    }
}
enable 自定义的date
management:
  endpoints:
    enabled-by-default: false
    web:
      base-path: /manage
      exposure:
        include: 'info,health,env,beans,date'
  endpoint:
    info:
      enabled: true
    health:
      enabled: true
    env:
      enabled: true
    beans:
      enabled: true
    date:
      enabled: true
你可以看到所有开放的接口中增加了date
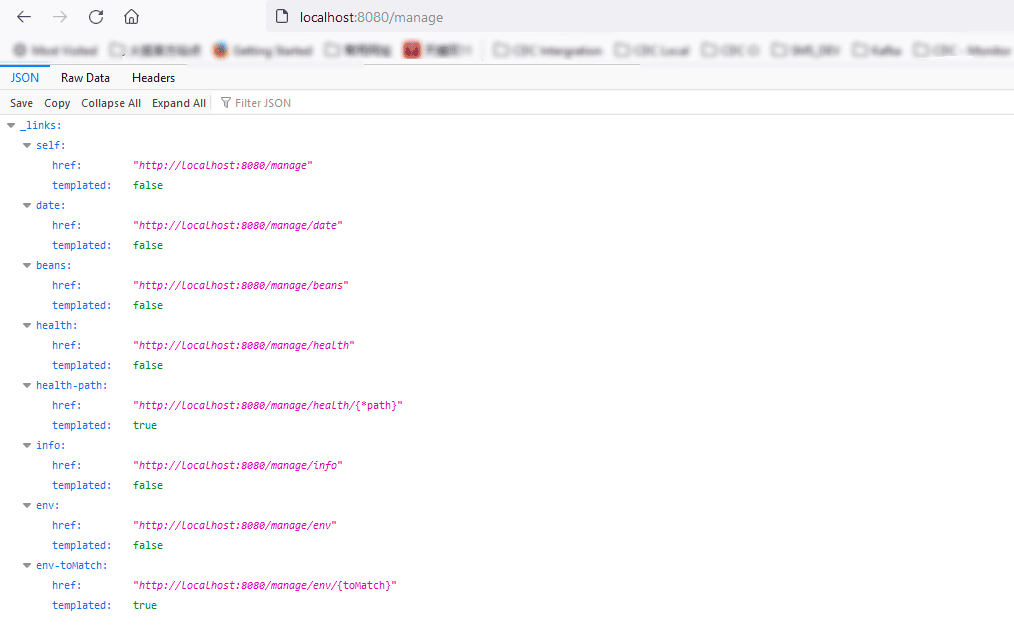
访问效果
组件的health状况
SpringBoot默认集成了如下常见中间件的health监控
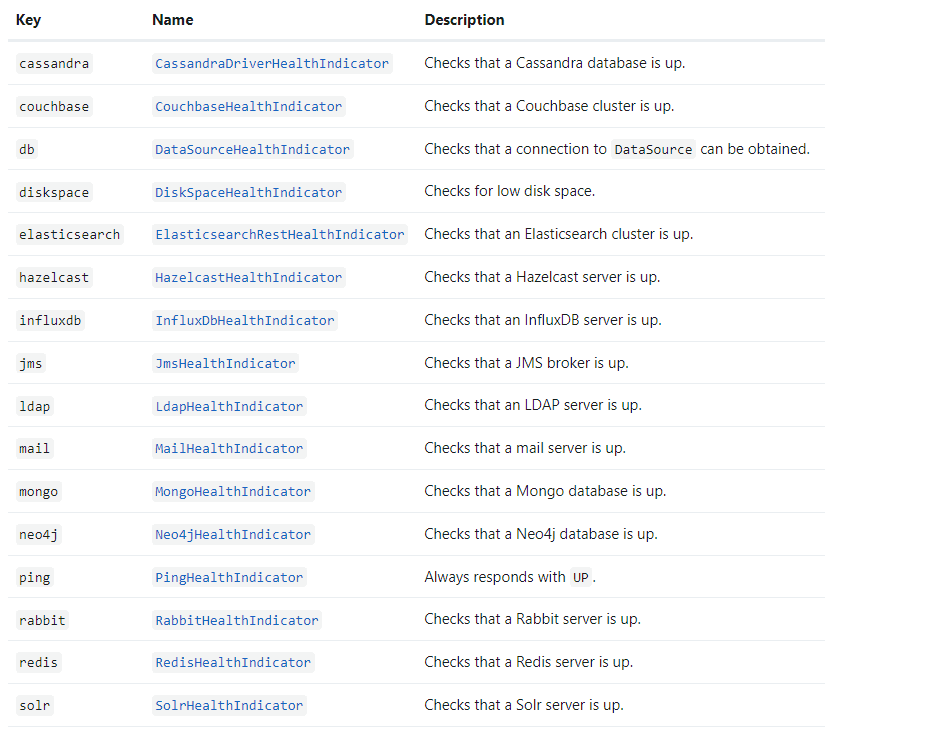
当然你也可以自定义HealthIndicator
package tech.pdai.springboot.actuator;

import org.springframework.boot.actuate.health.Health;
import org.springframework.boot.actuate.health.HealthIndicator;
import org.springframework.stereotype.Component;

/**
 * @author pdai
 */
@Component
public class CustomHealthIndicator implements HealthIndicator {

    @Override
    public Health health() {
        int errorCode = check();
        if (errorCode!=0) {
            return Health.down().withDetail("Error Code", errorCode).build();
        }
        return Health.up().build();
    }

    private int check() {
        // perform some specific health check
        return 0;
    }

}
更详细的信息可以参考官网
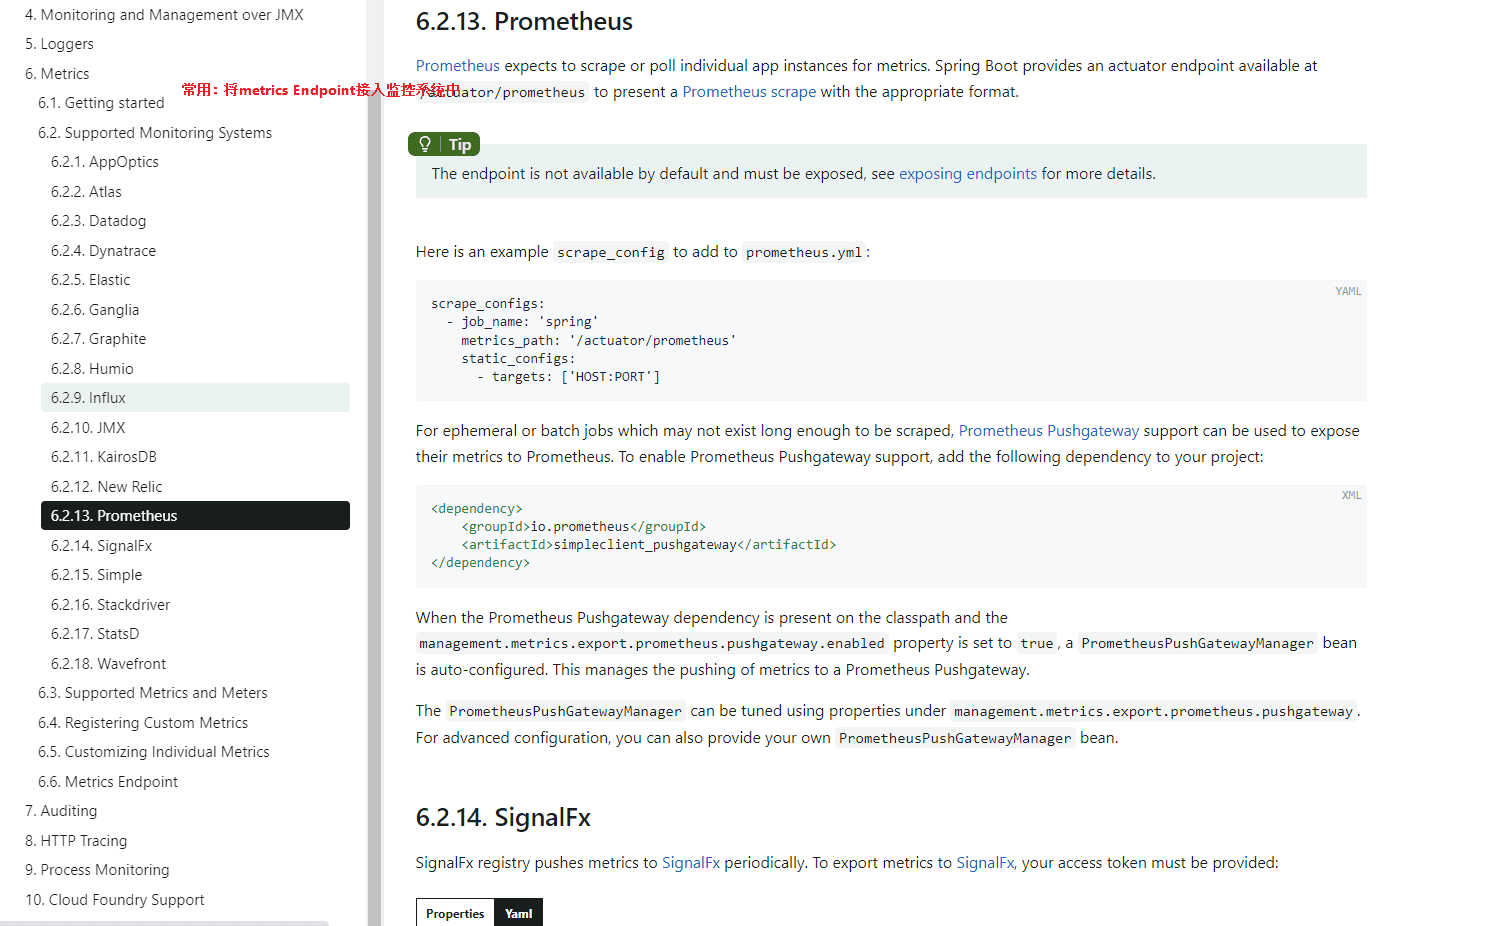
Metrics接入监控系统
这个也是比较常用的,具体参考
Info信息如何获取
有细心的小伙伴会发现/info是空的,最简单的配置方式是在spring-boot-maven-plugin中加入build-info, 编译成jar后运行,即可获取info:
<plugins>
    <plugin>
        <groupId>org.springframework.boot</groupId>
        <artifactId>spring-boot-maven-plugin</artifactId>
        <executions>
            <execution>
                <goals>
                    <goal>build-info</goal>
                </goals>
            </execution>
        </executions>
    </plugin>
</plugins>
示例源码
https://github.com/realpdai/tech-pdai-spring-demos
参考资料
https://docs.spring.io/spring-boot/docs/current/reference/html/actuator.html#actuator.enabling